N4VIEW WEB APP
One supervision
tool for all your trackers
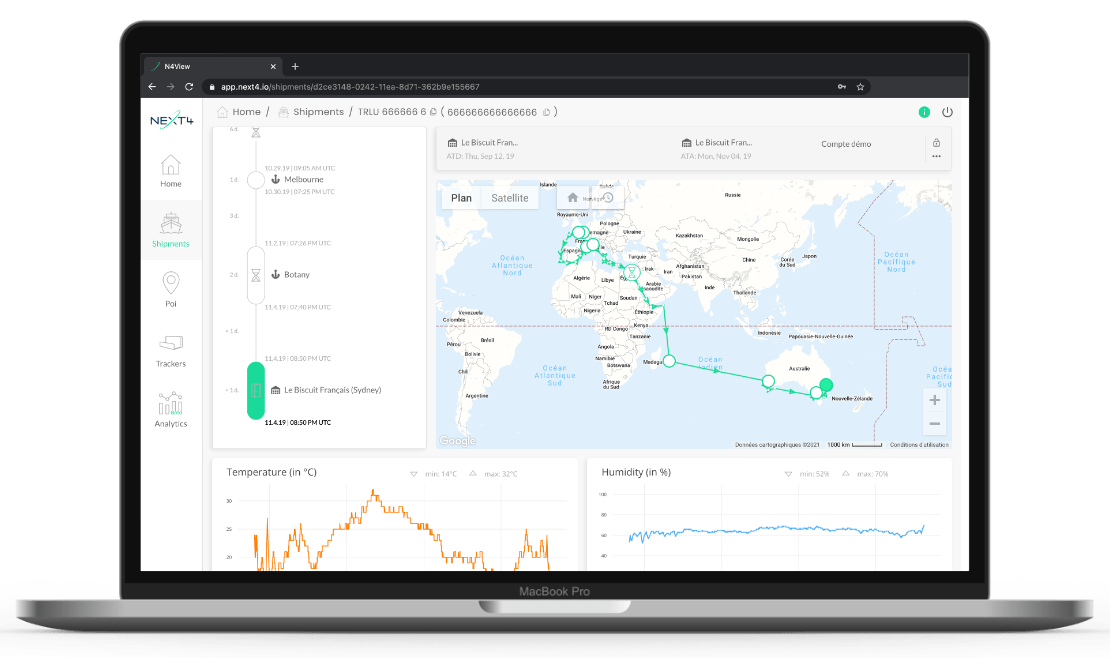
Control all your shipments in the same tool, N4VIEW, our web app which processes and displays the collected data from all trackers.
It provides real-time tracking of shipments, dynamic ETA calculation, analytics and alerts when events occur. Visualize data thanks to graphs, timelines, maps and more.
A control tower
for all your shipments

Devices data
for a better use
of your equipment

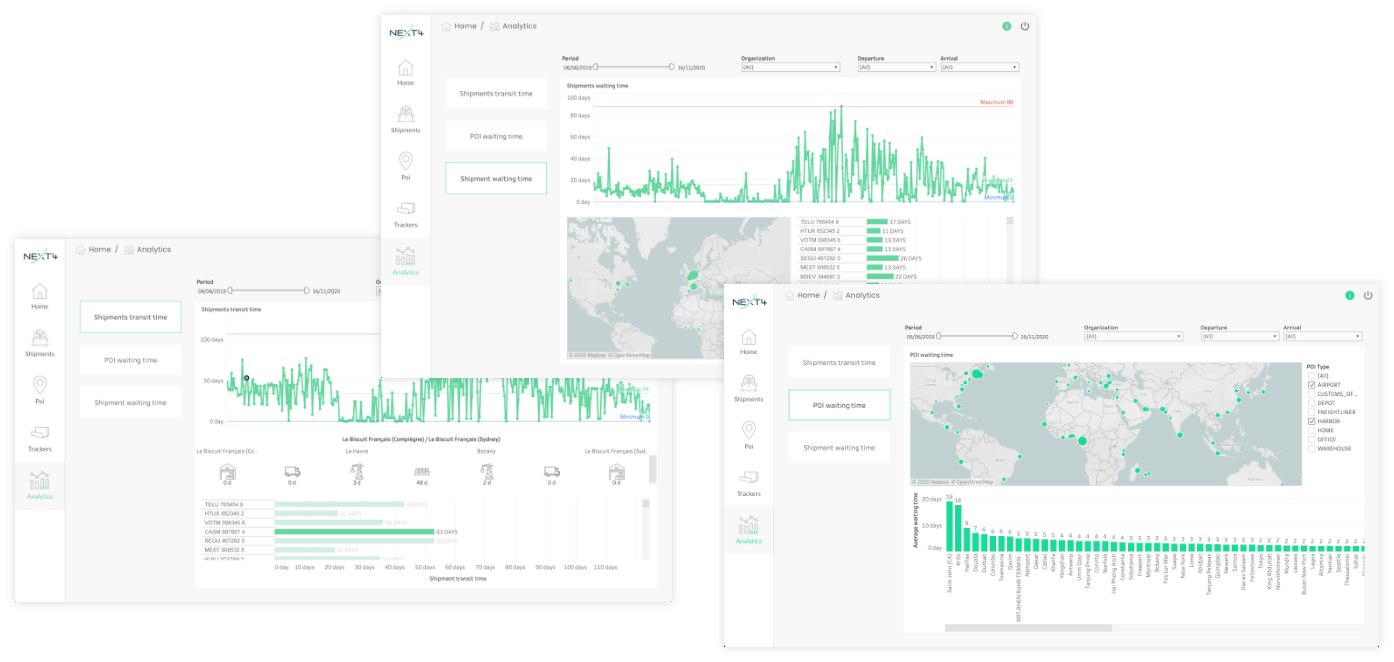
PDF reports and Analytics dashboards
to overview your shipments

Real-time alerts
suiting your
needs

Dynamic ETAs
for improved
predictions
Different uses according to your needs
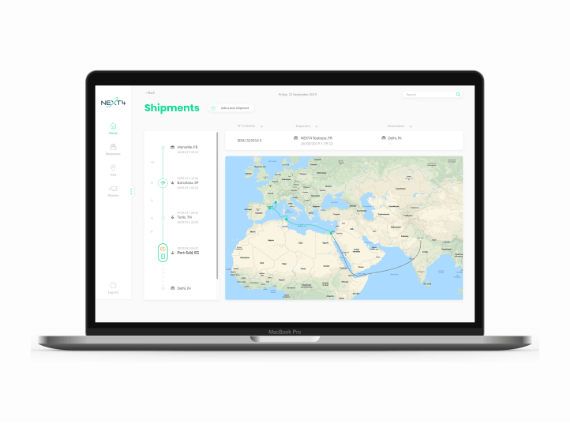
Use our native app and its supervision tools
Use all our Web App functionalities
Access supervision tools for your recurring shipments and your devices
Overview your shipments thanks to PDF reports and CSV exports
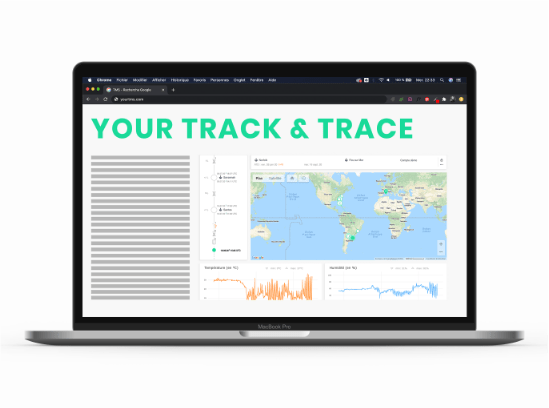
Embed our tools in your track & trace software
Public link functionality with your brand and logo
Embed your shipments view pages directly into your software
Share the shipments with your partners and customers
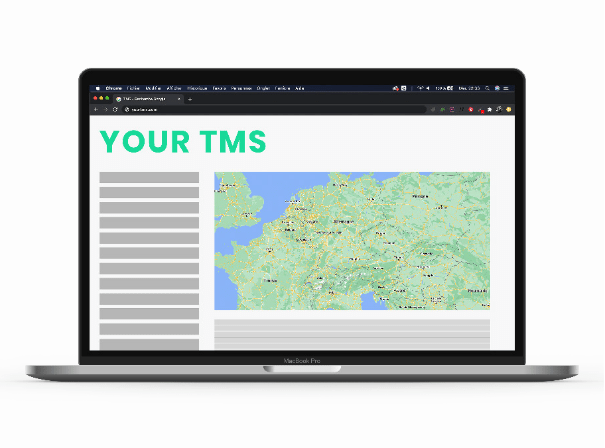
Receive your data directly in your TMS
Add real-time data to your information system
Via our API, immediately retrieve your data so that you can use it directly in your usual tools
Monitor your shipments with detail
A control tower : precise information in real-time
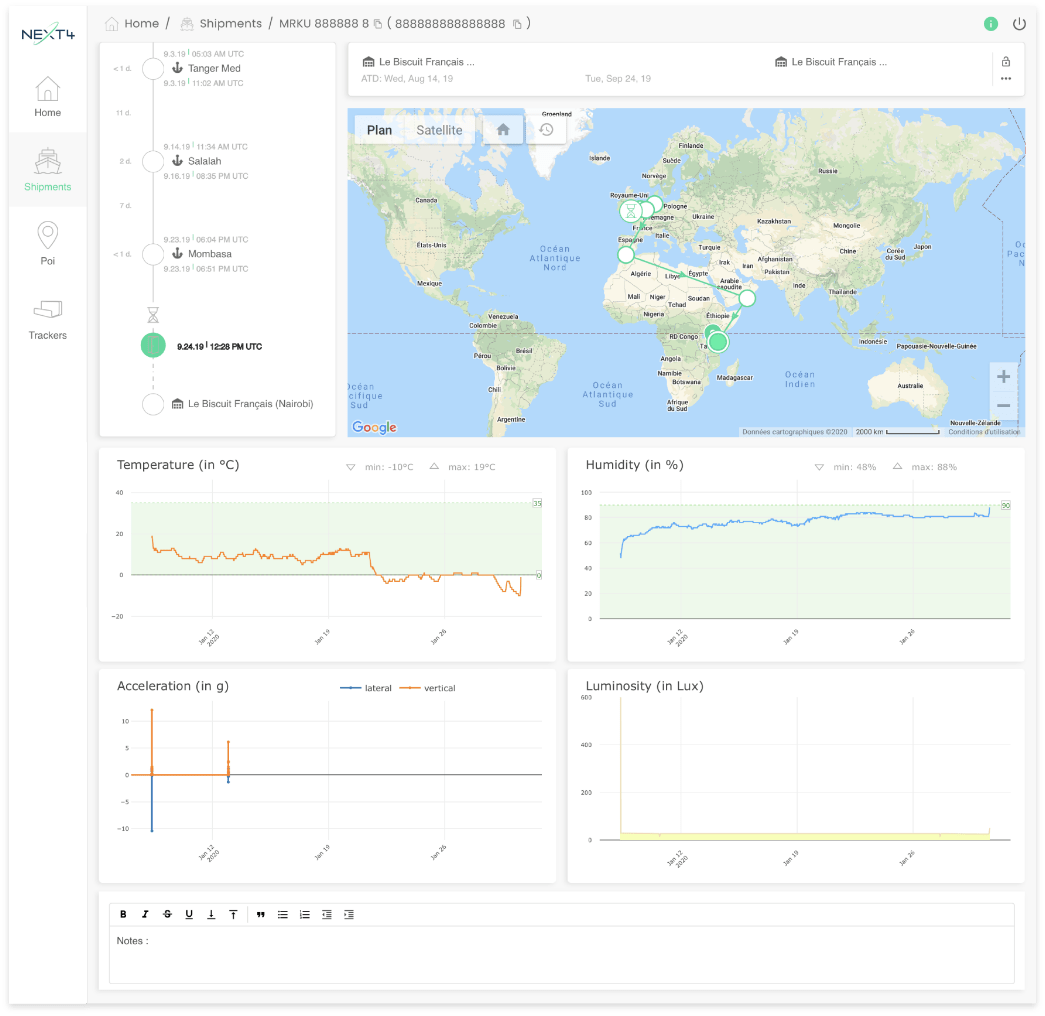
Follow and analyse each of your shipments thanks to different tools available in your shipment’s detailed view for a better control of your transit times.
The timeline enables you to follow with precision the passage and stop points of your goods, along with the journey’s events.
The interactive map traces the path followed by the container and locates the key points of the shipment : departures, stops, passage points, arrivals, alerts but also the current position.
The graphs offer real-time readings of the temperature and humidity variations inside of the container, but also the strenght of shocks and the luminosity levels.
Predective ETAs for better visibility and optimisation
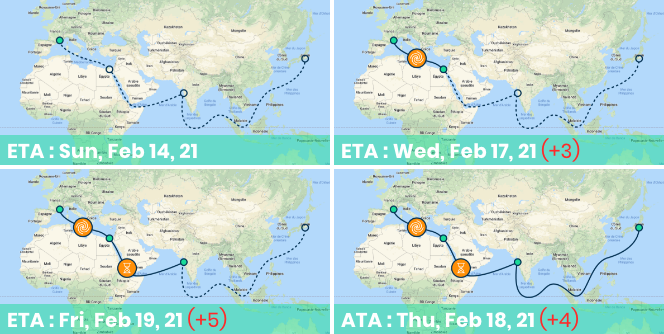
Based on your previous shipments, the events taking place during and the duration of each step of the trip, but also external data such as the weather or the potential risks, your ETA is calculated and continuously updated so you can improve the planning and scheduling of your transit times and reception of goods.
Take a step back with PDF reports
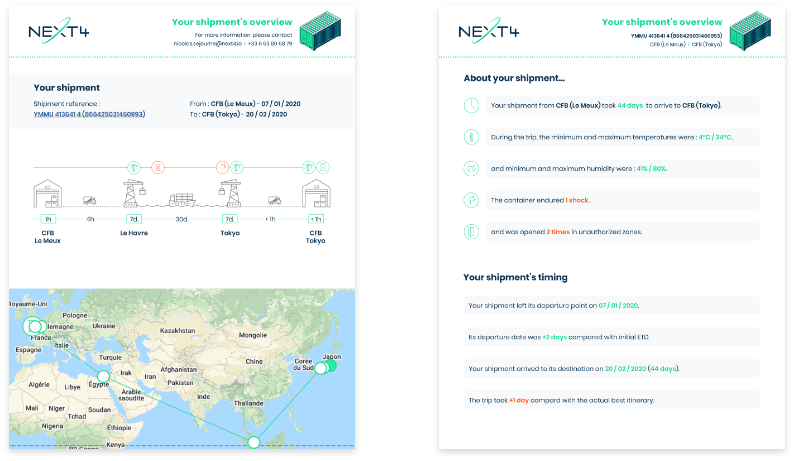
At the end of each shipment, you can generate a PDF report about this shipment.
This report will provide you with an overview and data about the route, the events and the timing of the shipment.
This functionality is bound to evolve and provide users with additional data in the following months.
Exception management
Consult exceptions thanks to alerts
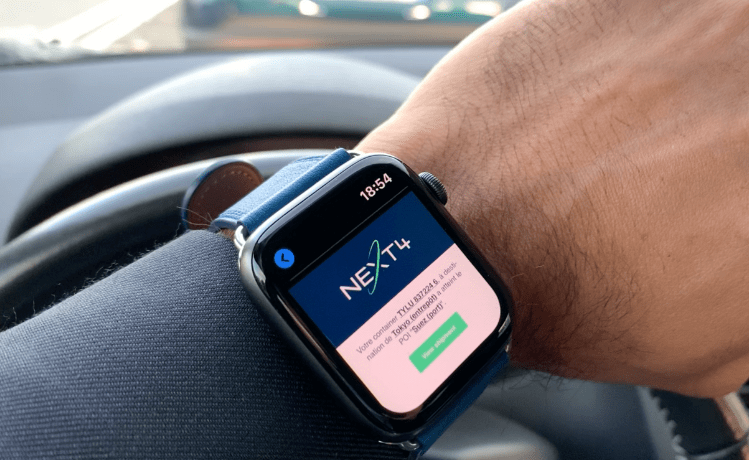
If only the unexpected and the anormal are a concern for you, N4VIEW allows you to configure alerts according to your needs.
Get notified in real time of anormal events such as door openings, ETA deviation, blank sailing, transhipment and more.
No need to keep an eye on your shipments on a regular basis : only consult them when a problem occurs.
Analytics dashboards
A global view on your shipments

Analysis
Compare, analyze & understand your shipments by taking a step back thanks to a global perspective and relevant KPIs.

identification
Identify regular problems, risk zones and delay factors that could impact your efficiency.
Optimization
Thanks to relevant data, optimise your transit times and transport conditions to improve your services.
Let’s connect!
Discover how NEXT4 can help you gain visibility and optimise your processes.

